Trong IELTS Writing Task 1, phần mở bài (introduction) đóng vai trò quan trọng trong việc giới thiệu biểu đồ và tạo tiền đề cho phần thân bài. Cách viết introduction Task 1 đúng chuẩn sẽ giúp bài viết logic hơn, tránh mất điểm do thiếu sót thông tin. Hãy cùng The Catalyst for English khám phá những phương pháp đơn giản nhưng hiệu quả để viết phần mở bài mạch lạc, ấn tượng.
I. Tìm hiểu khái quát về IELTS Writing Task 1
Tìm hiểu khái quát về IELTS Writing Task 1
IELTS Writing Task 1 là một trong hai bài viết thí sinh cần hoàn thành ở kỹ năng Writing, với mục tiêu tóm tắt, mô tả và phân tích các xu hướng/số liệu/quá trình xuất hiện trong biểu đồ cho sẵn. Để làm tốt điều này, việc nắm vững cấu trúc Writing Task 1 chuẩn là yêu cầu bắt buộc. Sau khi hoàn thành phần Introduction, bước quan trọng tiếp theo là viết đoạn tổng quan. Để hiểu rõ cách tóm tắt các đặc điểm chính, bạn nên xem qua hướng dẫn về Cách Viết Overview Task 1.
Các dạng đề Writing Task 1:
Biểu đồ
Lưu ý chung
Lưu ý cho Introduction
Line graph
Thể hiện sự thay đổi qua thời gian
Biểu thị các xu hướng (rise, fall, fluctuate, remain stable)
Cần nắm được dữ liệu ở trục x và trục y
Tập trung vào các xu hướng chung, tránh nhắc các số liệu cụ thể
Nên cung cấp khung thời gian của biểu đồ
Bar chart (dạng thường/nhóm/xếp chồng)
So sánh các đối tượng khác nhau
Chỉ thể hiện các giá trị cao nhất/thấp nhất của số liệu
Cần nắm được sự khá`c biệt giữa Bar chart thường/ nhóm/ xếp chồng trước khi làm
Cần nắm rõ đối tượng được so sánh là gì
Tránh nhắc tên tất cả các đối tượng trong intro
Pie chart
Thể hiện các phần (segments) của một tổng (100%)
Cần so sánh giữa các phần
Đơn vị là %
Cần chú ý xem có sự thay đổi qua thời gian hay không
Tránh nhắc tên tất cả các segments trong intro
Table
Cung cấp dữ liệu bằng các cột & hàng
Cần xác định các số liệu chính/nổi bật nhất và những sự khác biệt dễ thấy nhất
Cần mô tả các xu hướng trong dữ liệu
Cần sử dụng đúng thì tuỳ theo thời gian trong biểu đồ
Cần có đủ 3 yếu tố:
Chủ đề (biểu đồ nói về gì),
bao nhiêu đối tượng (được biểu thị bởi các đường),
địa điểm (nếu đề bài đề cập thì cần đưa vào intro),
thời gian.
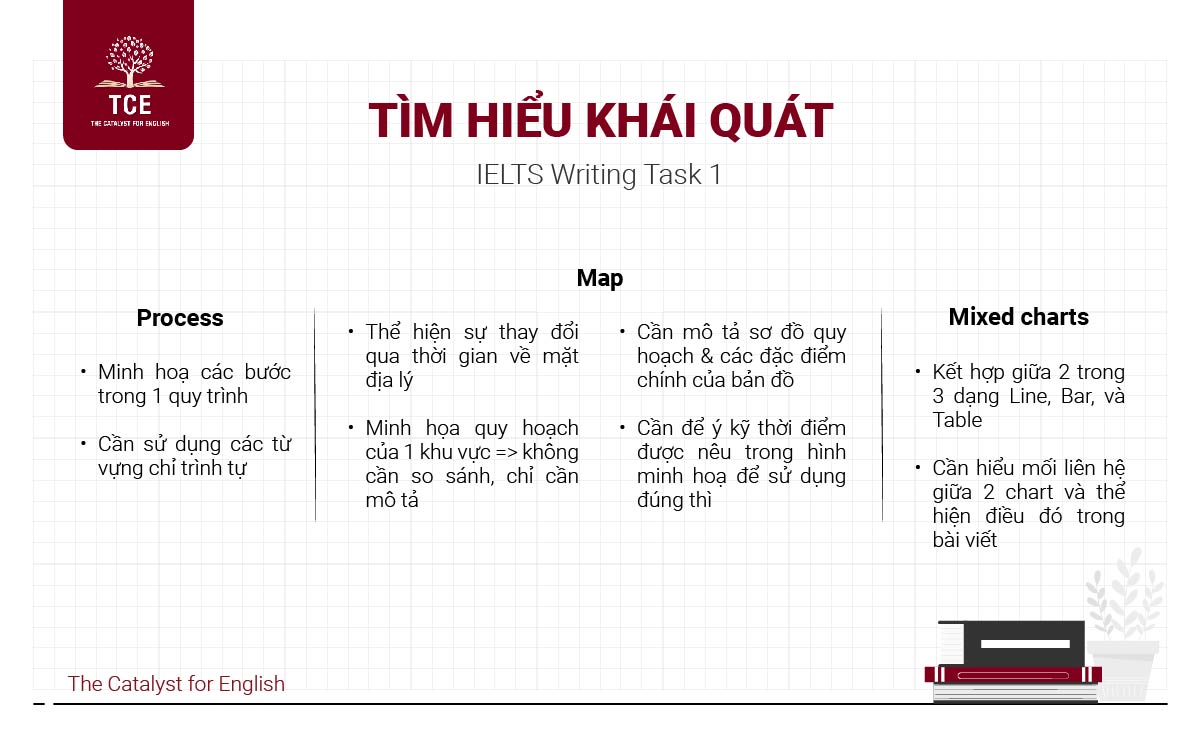
Process
Minh hoạ các bước trong 1 quy trình (tự nhiên/nhân tạo)
Cần sử dụng các từ vựng chỉ trình tự (first, then, next, finally)
Cần tả các bước của quy trình
Có thể sử dụng câu bị động (đối với quy trình nhân tạo)
Chỉ paraphrase đề bài đơn giản
Không được nhắc tới các bước/giai đoạn của quy trình trong intro
Map
Thể hiện sự thay đổi qua thời gian về mặt địa lý (đối với dạng đề 2 bản đồ) => Cần so sánh bản vẽ trước & sau
Minh họa quy hoạch của 1 khu vực (đối với dạng đề 1 bản đồ) => không cần so sánh, chỉ cần mô tả
Cần mô tả sơ đồ quy hoạch & các đặc điểm chính của bản đồ
Cần để ý kỹ thời điểm được nêu trong hình minh hoạ để sử dụng đúng thì
Cần sử dụng ngôn ngữ chỉ địa điểm cụ thể (north, south, adjacent to,…)
Cần paraphrase đúng theo dạng đề, không sử dụng ngôn ngữ nói về sự thay đổi khi làm dạng đề 1 bản đồ
Mixed charts
Kết hợp giữa 2 trong 3 dạng Line, Bar, và Table
Cần hiểu mối liên hệ giữa 2 chart và thể hiện điều đó trong bài viết
Cần mô tả kết hợp 2 biểu đồ
Cần mô tả cả 2 biểu đồ đều nhau
Đề cập cả 2 charts và công dụng của chúng trong intro
Như vậy, bạn đã nắm được các dạng đề chính thường xuất hiện. Việc nhận diện đúng dạng bài là bước đầu tiên và quan trọng nhất, vì nó sẽ quyết định cách bạn tiếp cận toàn bộ bài viết. Để có một cái nhìn tổng thể về chiến lược làm bài từ A-Z cho mọi dạng, bạn có thể tham khảo hướng dẫn chung về cách viết IELTS Writing Task 1. Giờ thì hãy cùng đi sâu vào công thức viết phần mở bài cho từng loại biểu đồ nhé!
II. Cách viết Introduction Task 1 trong IELTS Writing đơn giản
Cách viết Introduction Task 1
Sau đây là một số công thức giúp thí sinh biết được cách viết Introduction Task 1 từng dạng biểu đồ. Cùng tham khảo nhé!
Biểu đồ
Công thức & Ví dụ
Line graph
The line graph
shows
illustrates
demonstrates
compares
số đối tượng & chủ đề
from … to …/
between … and …/
over a period of … years/
over … years starting from …
VD: The line graph compares the unemployment rates in the USA over 10 years starting from 2010.
Bar chart
The bar chart
shows
illustrates
demonstrates
gives information about
số đối tượng & chủ đề
from … to …/
between … and …/
over a period of … years/
over … years starting from …
VD (đề static): The bar chart shows the number of books sold in 4 different countries in 2020.
VD (đề dynamic): The bar chart gives information about the number of vehicles that was bought in the UK from 2000 to 2005.
Pie chart
The pie chart
shows
illustrates
demonstrates
highlights
số đối tượng & chủ đề
in + năm cụ thể
(tuyệt đối không dùng from…to/ between … and…/ over … years)
VD (đề static): The pie chart shows the energy consumption by 5 different sources in 2020.
VD (đề dynamic): The two pie charts illustrate the energy consumption by 5 different sources in the years 2000 and 2010.
Table
The table
highlights
compares
presents
displays
số đối tượng & chủ đề
in + năm cụ thể (đề static – nếu có năm trong bảng)
in/over … years (đề dynamic – số năm được cho trong bảng)
(tuyệt đối không dùng from…to/ between … and…)
VD (đề static): The table shows the average monthly salary in five cities in 2015.
VD (đề dynamic): The table displays the expenses in a school in Sydney over 3 years.
Process
QT nhân tạo
The diagram
shows
illustrates
demonstrates
presents
the stages/steps/process in which
… was created/made/manufactured/
the process of making/creating/ manufacturing …
QT tự nhiên
the stages/steps/process of [tên quy trình]
VD (QT tự nhiên): The diagram shows the stages of the life of a salmon.
VD (QT nhân tạo): The diagram shows the process of making cane sugar.
Map
1 map
The map
shows
illustrates
demonstrates
presents
the layout/
the plan/
the blueprint
of [Địa điểm]
Time
VD: The map presents the layout of a farm in 2013.
2 maps
The maps
show
illustrate
demonstrate
depict
describe
how [Địa điểm] changed
the changes (seen) in [Địa điểm]
the changes [Địa điểm] underwent
Time
VD: The maps depict the changes seen in a coastal town from 1990 to 2020.
Mixed charts
The [kiểu biểu đồ 1] + shows + số đối tượng & chủ đề
, and
, while
[kiểu biểu đồ 2] + shows + số đối tượng & chủ đề
Time (nếu có)
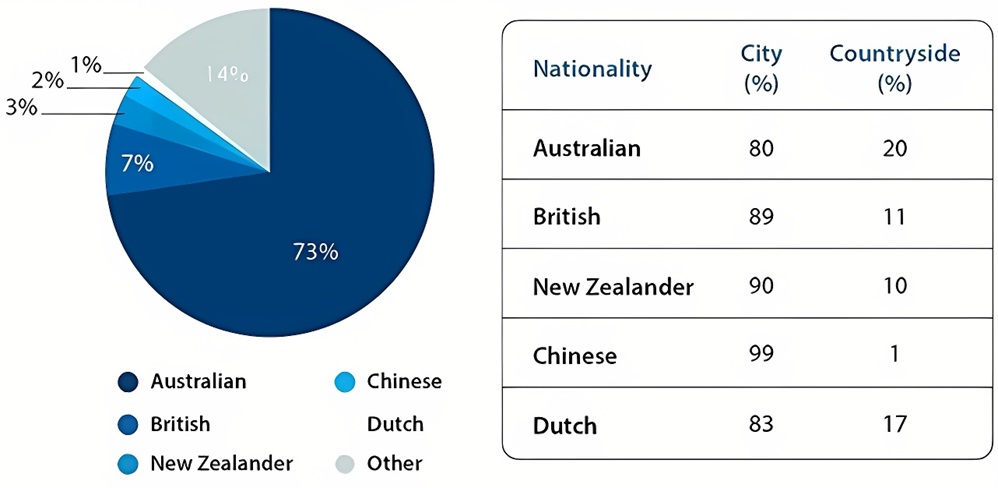
The table and pie chart give information about the population in Australia according to different nationalities and areas.
Ví dụ
VD: The pie chart illustrates the ratio of the Australian population from different nationalities, while the table compares said populations in two residing areas.
Trên đây là các công thức nền tảng, nhưng để biến chúng thành một bài viết hoàn chỉnh, bạn cần sự hướng dẫn từ những chuyên gia thực thụ. Việc tự học có thể giúp bạn biết, nhưng chỉ có chuyên gia mới giúp bạn làm đúng và làm hay.
Tại TCE, đội ngũ giảng viên với điểm IELTS 8.0+ Overall sẽ là người trực tiếp đồng hành cùng bạn. Với kinh nghiệm dày dạn, các thầy cô sẽ giúp bạn xây dựng một chiến lược làm bài vững chắc thông qua các khóa học IELTS được thiết kế chuyên sâu. Sau đó, hãy kiểm tra sự tiến bộ của mình qua các kỳ thi thử IELTS trên máy tính chuẩn hóa. Lộ trình này đã giúp hàng trăm học viên cải thiện điểm số rõ rệt và đạt được mục tiêu IELTS một cách hiệu quả.
III. Một số cụm từ giúp bạn ghi điểm trong phần introduction task 1
Cách thí sinh paraphrase đề bài để viết Introduction sẽ là ấn tượng đầu tiên với Examiner (giám khảo) khi chấm bài. Kỹ năng then chốt ở đây không chỉ là thay đổi một vài từ, mà là diễn giải lại toàn bộ câu hỏi một cách chính xác và tự nhiên. Để tìm hiểu sâu hơn về các phương pháp và từ vựng hiệu quả, bạn có thể tham khảo bài viết chi tiết về cách paraphrase Writing Task 1. Nắm vững kỹ năng này sẽ giúp bạn tạo một khởi đầu hoàn hảo cho bài viết của mình.
Để đạt được điểm tốt cho tiêu chí Lexical resource ở phần Writing task 1 chắc chắn không chỉ dựa vào phần Introduction, mà còn cần xét tới cả đoạn Overview và Body paragraphs. Tuy nhiên, cách thí sinh paraphrase đề bài để viết Introduction sẽ là ấn tượng đầu tiên với Examiner (giám khảo) khi chấm bài. Vậy nên, hãy đảm bảo rằng mình dành thời gian đọc hiểu đề bài & biểu đồ, rồi mới bắt tay vào viết Introduction để tránh viết sai/lạc đề nhé!
Với mỗi dạng biểu đồ, TCE đã gợi ý cho bạn đọc các từ vựng hay & phù hợp để tạo một ấn tượng tốt cho Examiner (tại bảng ở phần II. Cách viết introduction task 1 trong IELTS Writing đơn giản – các từ vựng được in đậm).
Thí sinh hãy lưu ý rằng sử dụng từ vựng cần sự chính xác về mặt ngữ nghĩa, ngữ cảnh và chính tả nhé!
IV. Tham khảo mẫu Introduction Task 1 hay cho từng dạng bài
Lý thuyết sẽ trở nên dễ hiểu hơn khi đi kèm với ví dụ thực tế. Vì vậy, trước khi bắt tay vào luyện viết, việc tham khảo các bài IELTS Writing Task 1 Sample hoàn chỉnh sẽ giúp bạn hình dung rõ hơn cách triển khai một bài viết từ đầu đến cuối. Sau khi đã có cái nhìn tổng quan, hãy cùng TCE tìm hiểu cách viết phần mở bài (introduction) cho 7 dạng bài phổ biến trong IELTS Writing Task 1 nhé!
1. Line graph
Đề bài dạng Line graph
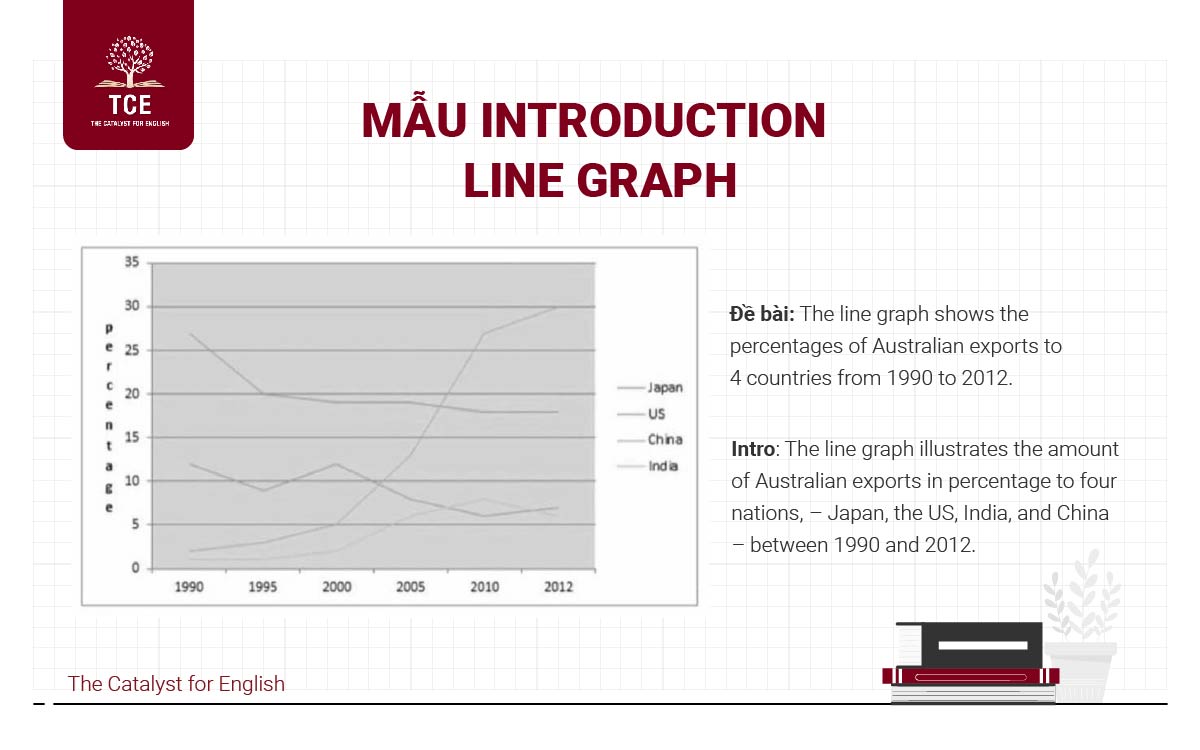
Đề bài: The line graph shows the percentages of Australian exports to 4 countries from 1990 to 2012.
Intro: The line graph illustrates the amount of Australian exports in percentage to four nations, – Japan, the US, India, and China – between 1990 and 2012.
2. Bar chart
Đề bài dạng Bar chart
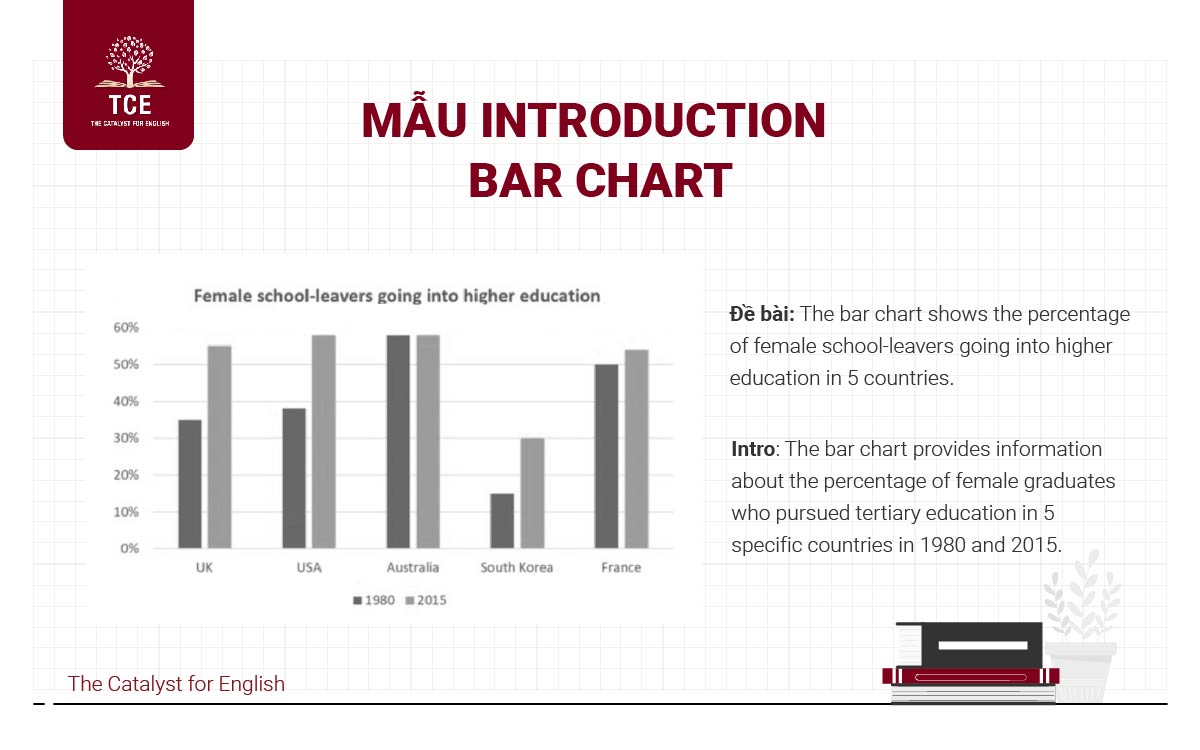
Đề bài: The bar chart shows the percentage of female school-leavers going into higher education in 5 countries.
Intro: The bar chart provides information about the percentage of female graduates who pursued tertiary education in 5 specific countries in 1980 and 2015.
3. Pie chart
Đề bài dạng Pie chart
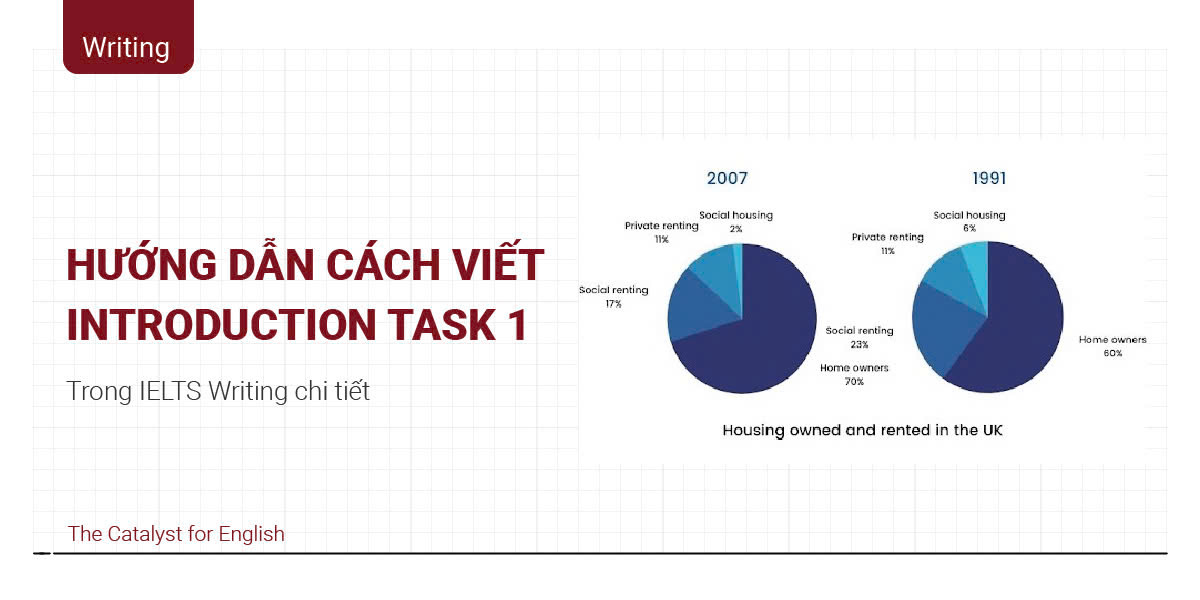
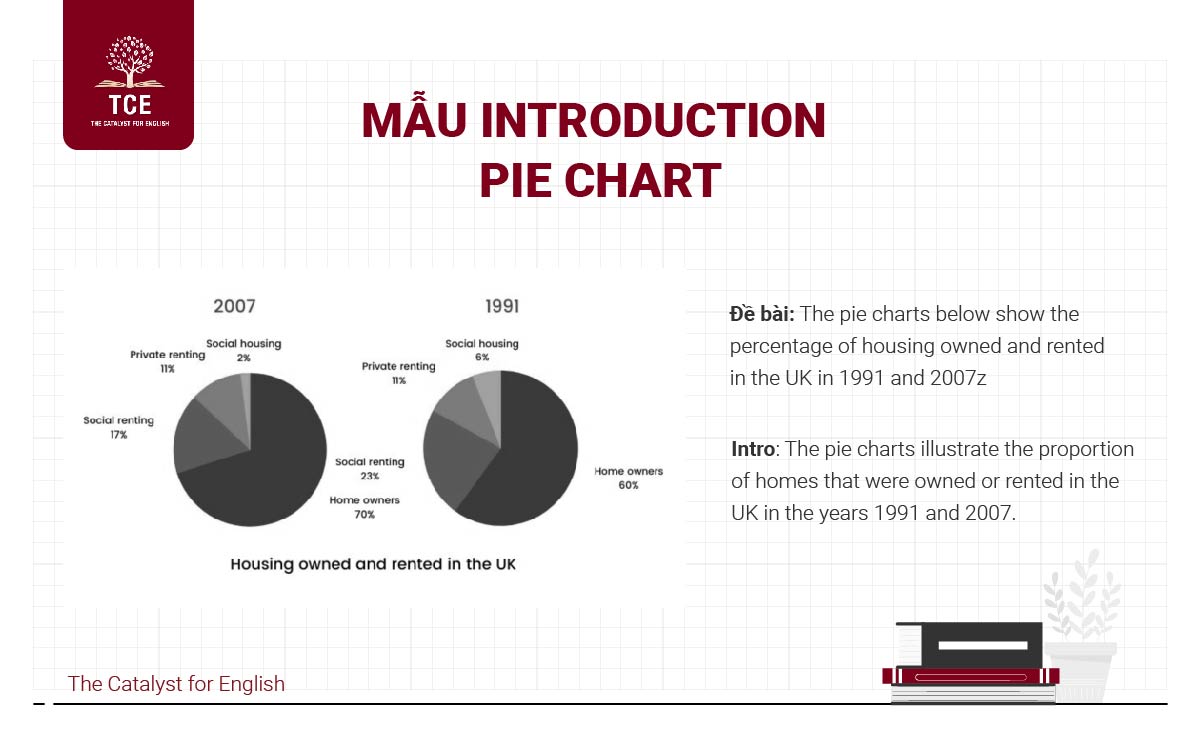
Đề bài: The pie charts below show the percentage of housing owned and rented in the UK in 1991 and 2007
Intro: The pie charts illustrate the proportion of homes that were owned or rented in the UK in the years 1991 and 2007.
4. Table
Đề bài dạng Table
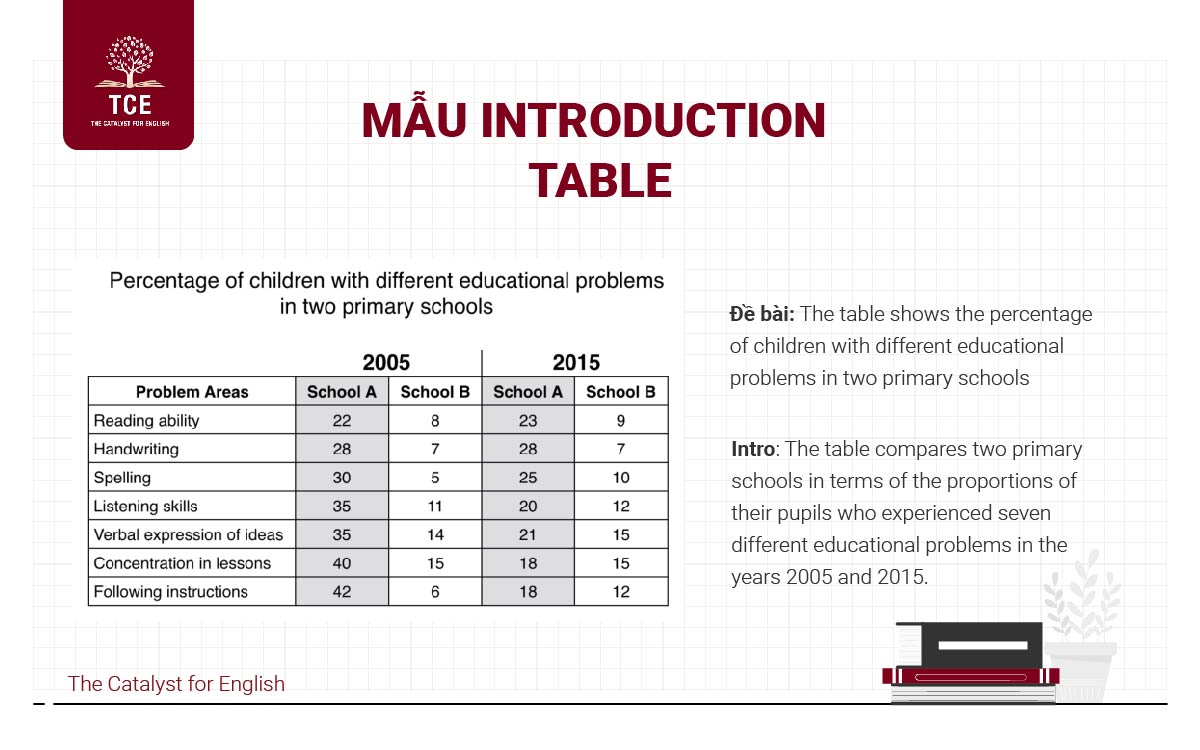
Đề bài: The table shows the percentage of children with different educational problems in two primary schools
Intro: The table compares two primary schools in terms of the proportions of their pupils who experienced seven different educational problems in the years 2005 and 2015.
5. Process
Đề bài dạng Process
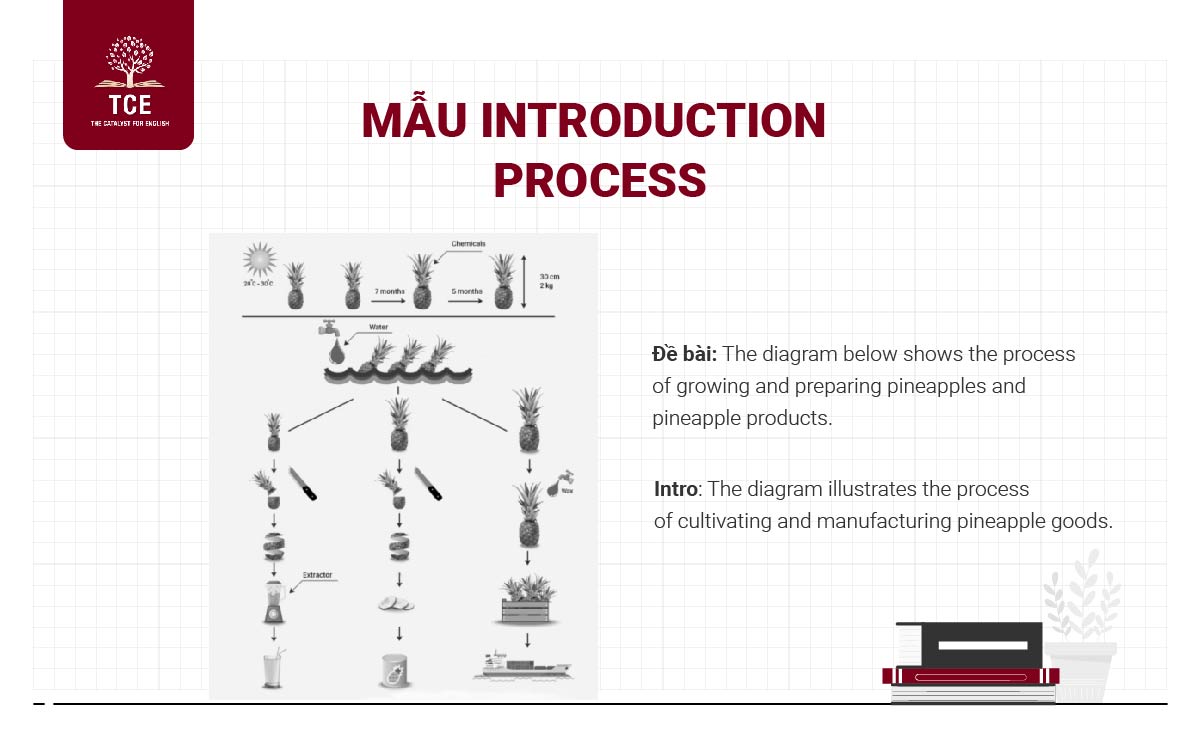
Đề bài: The diagram below shows the process of growing and preparing pineapples and pineapple products.
Intro: The diagram illustrates the process of cultivating and manufacturing pineapple goods.
6. Map
Đề bài dạng Map
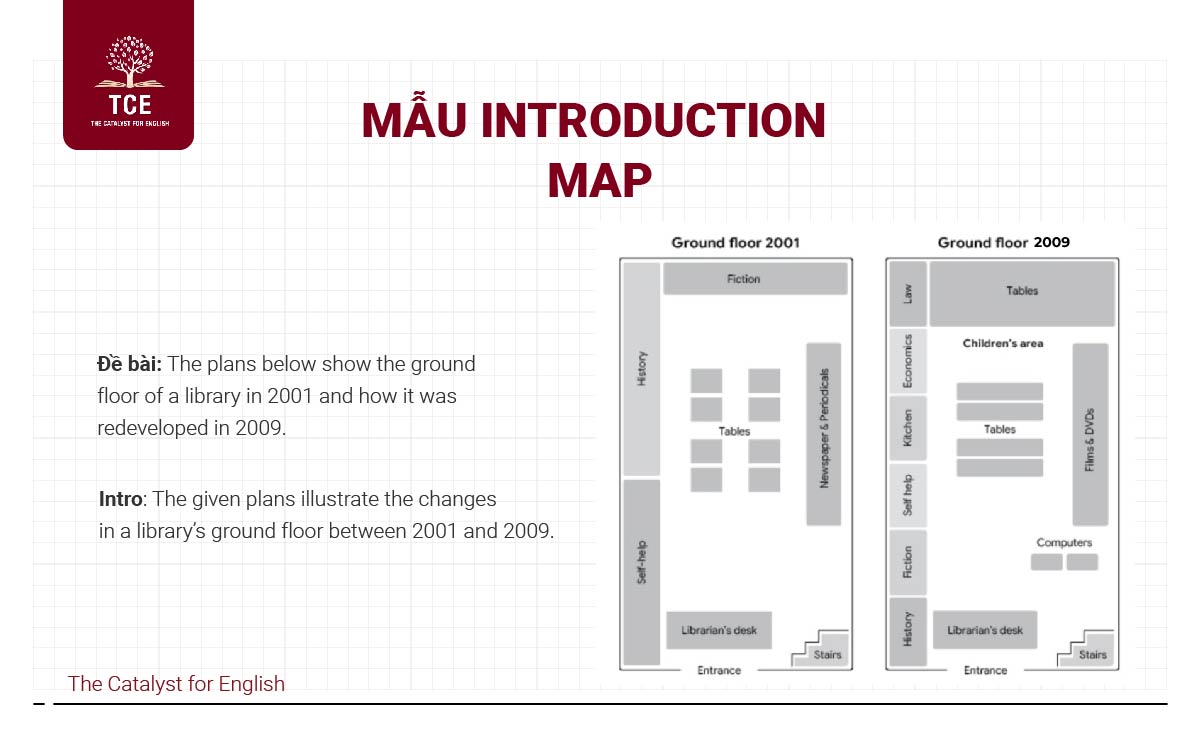
Đề bài (dạng 2 maps): The plans below show the ground floor of a library in 2001 and how it was redeveloped in 2009.
Intro: The given plans illustrate the changes in a library’s ground floor between 2001 and 2009.
Map of a place
Đề bài (dạng 1 map): The map below shows the plan of a proposed new town.
Intro: The map demonstrates the layout of a suggested new commune/settlement.
7. Mixed charts
Đề bài dạng Mixed charts
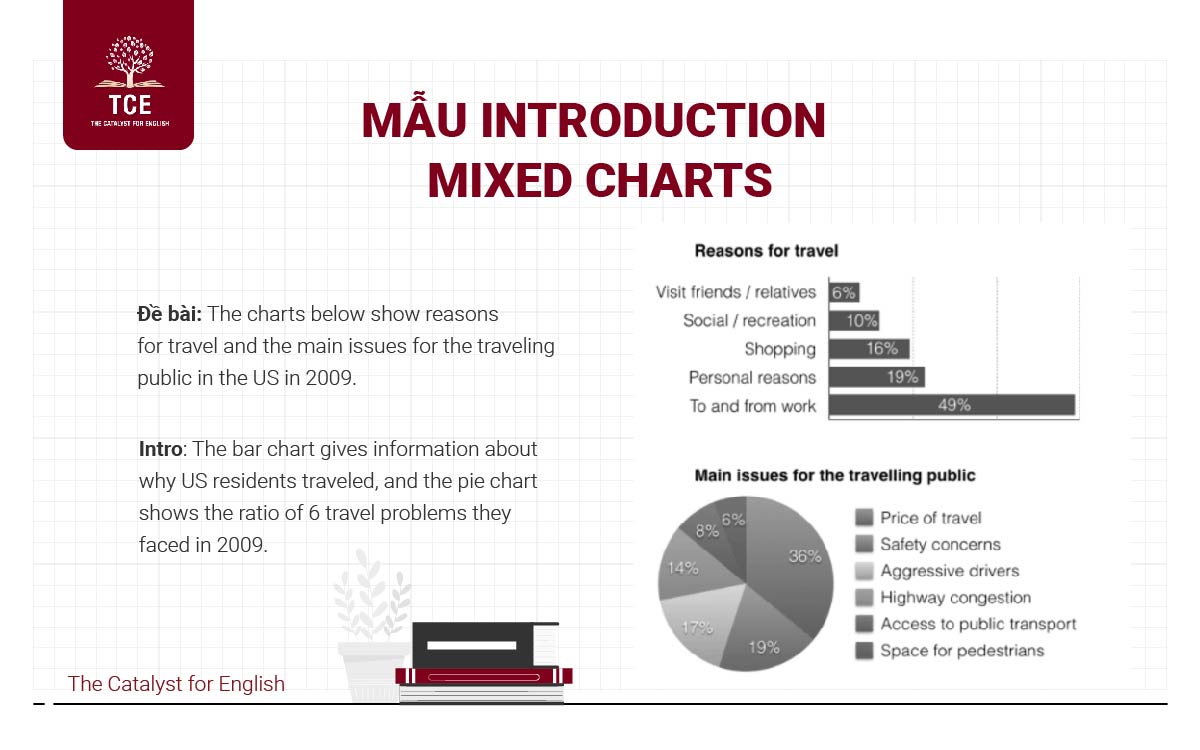
Đề bài: The charts below show reasons for travel and the main issues for the traveling public in the US in 2009.
Intro: The bar chart gives information about why US residents traveled, and the pie chart shows the ratio of 6 travel problems they faced in 2009.
Nắm vững cách viết Introduction nghĩa là bạn đã có một khởi đầu hoàn hảo. Tuy nhiên, đây mới chỉ là viên gạch đầu tiên. Để xây nên một bài viết hoàn chỉnh, bạn cần kết nối nó một cách logic với đoạn Overview và các đoạn thân bài chi tiết. Hãy tiếp tục hành trình chinh phục Task 1 cùng The Catalyst bằng cách khám phá chuyên mục IELTS Writing của chúng tôi, nơi có đầy đủ hướng dẫn cho mọi dạng bài!
Xin chào, mình là Phương ThảoCo-founder tại The Catalyst for English. Với hơn 7 năm kinh nghiệm đồng hành cùng các bạn học viên trên con đường chinh phục tiếng Anh, IELTS và sở hữu điểm Overall 8.5, mình luôn mong muốn chia sẻ những phương pháp học tập hiệu quả nhất để giúp bạn tiết kiệm thời gian và đạt được kết quả cao.
Tại The Catalyst for English, mình cùng đội ngũ giáo viên luôn đặt 3 giá trị cốt lõi: Connected – Disciplined – Goal-oriented (Kết nối – Kỉ luật – Hướng về kết quả) lên hàng đầu. Bởi chúng mình hiểu rằng, mỗi học viên đều có những điểm mạnh và khó khăn riêng, và vai trò của "người thầy" là tạo ra một môi trường học tập thân thiện, luôn luôn thấu hiểu và đồng hành từng học viên, giúp các bạn không cảm thấy "đơn độc" trong một tập thể.
Những bài viết này được chắt lọc từ kinh nghiệm giảng dạy thực tế và quá trình tự học IELTS của mình, hy vọng đây sẽ là nguồn cảm hứng và hành trang hữu ích cho các bạn trên con đường chinh phục tiếng Anh.
 thecatalyst.edu.vn