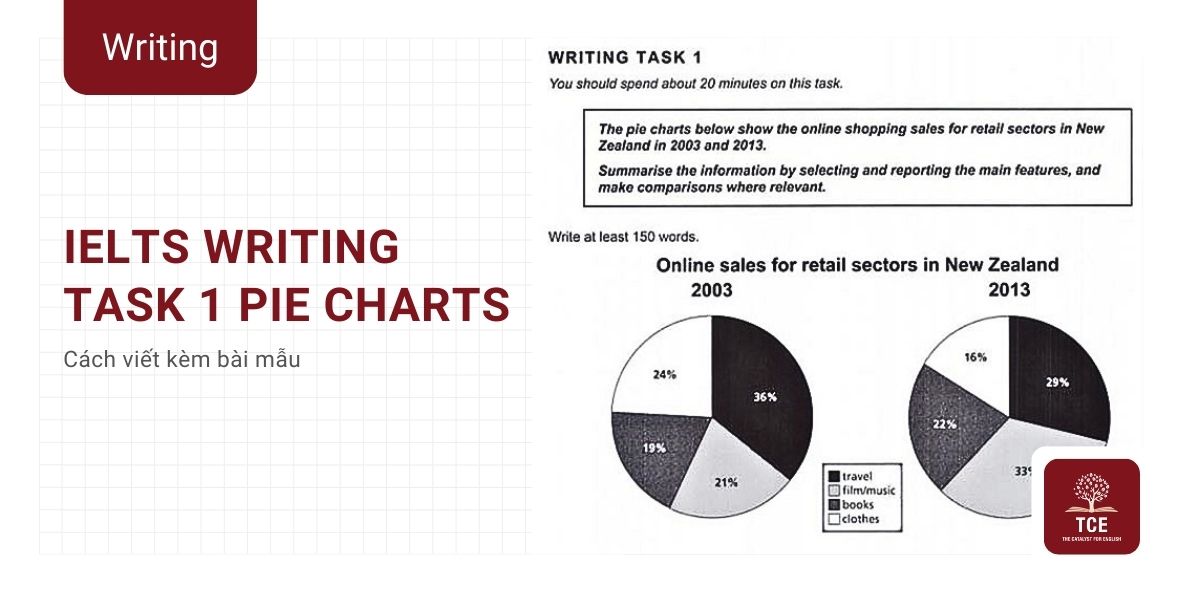
Dạng bài IELTS Writing Task 1 Pie Chart khiến nhiều bạn học sinh cảm thấy lo lắng vì biểu đồ tròn có thể bao gồm nhiều phần với các tỷ lệ khác nhau, và việc phân tích các thông tin này là điều không dễ dàng. Vì thế, hãy cùng The Catalyst for English tìm hiểu chi tiết về cách nhận diện, phân tích và viết bài cho Pie Chart IELTS Task 1 trong bài viết này nhé!
I. Tổng quan về dạng Pie Chart IELTS Task 1
Đầu tiên, chúng mình cùng nhau tìm hiểu IELTS Writing Task 1 Pie Chart bao gồm khái niệm, các dạng bài và cấu trúc của dạng bài biểu đồ tròn nhé:
1. Pie Chart là gì?
IELTS Writing Task 1 Pie Chart là dạng biểu đồ hình tròn, thường được sử dụng để thể hiện tỷ lệ hoặc phần trăm của một tập hợp dữ liệu. Mỗi phần của biểu đồ tròn IELTS đại diện cho một danh mục và kích thước của nó tương ứng với tỷ lệ phần trăm của toàn bộ biểu đồ Pie chart.
Ví dụ:
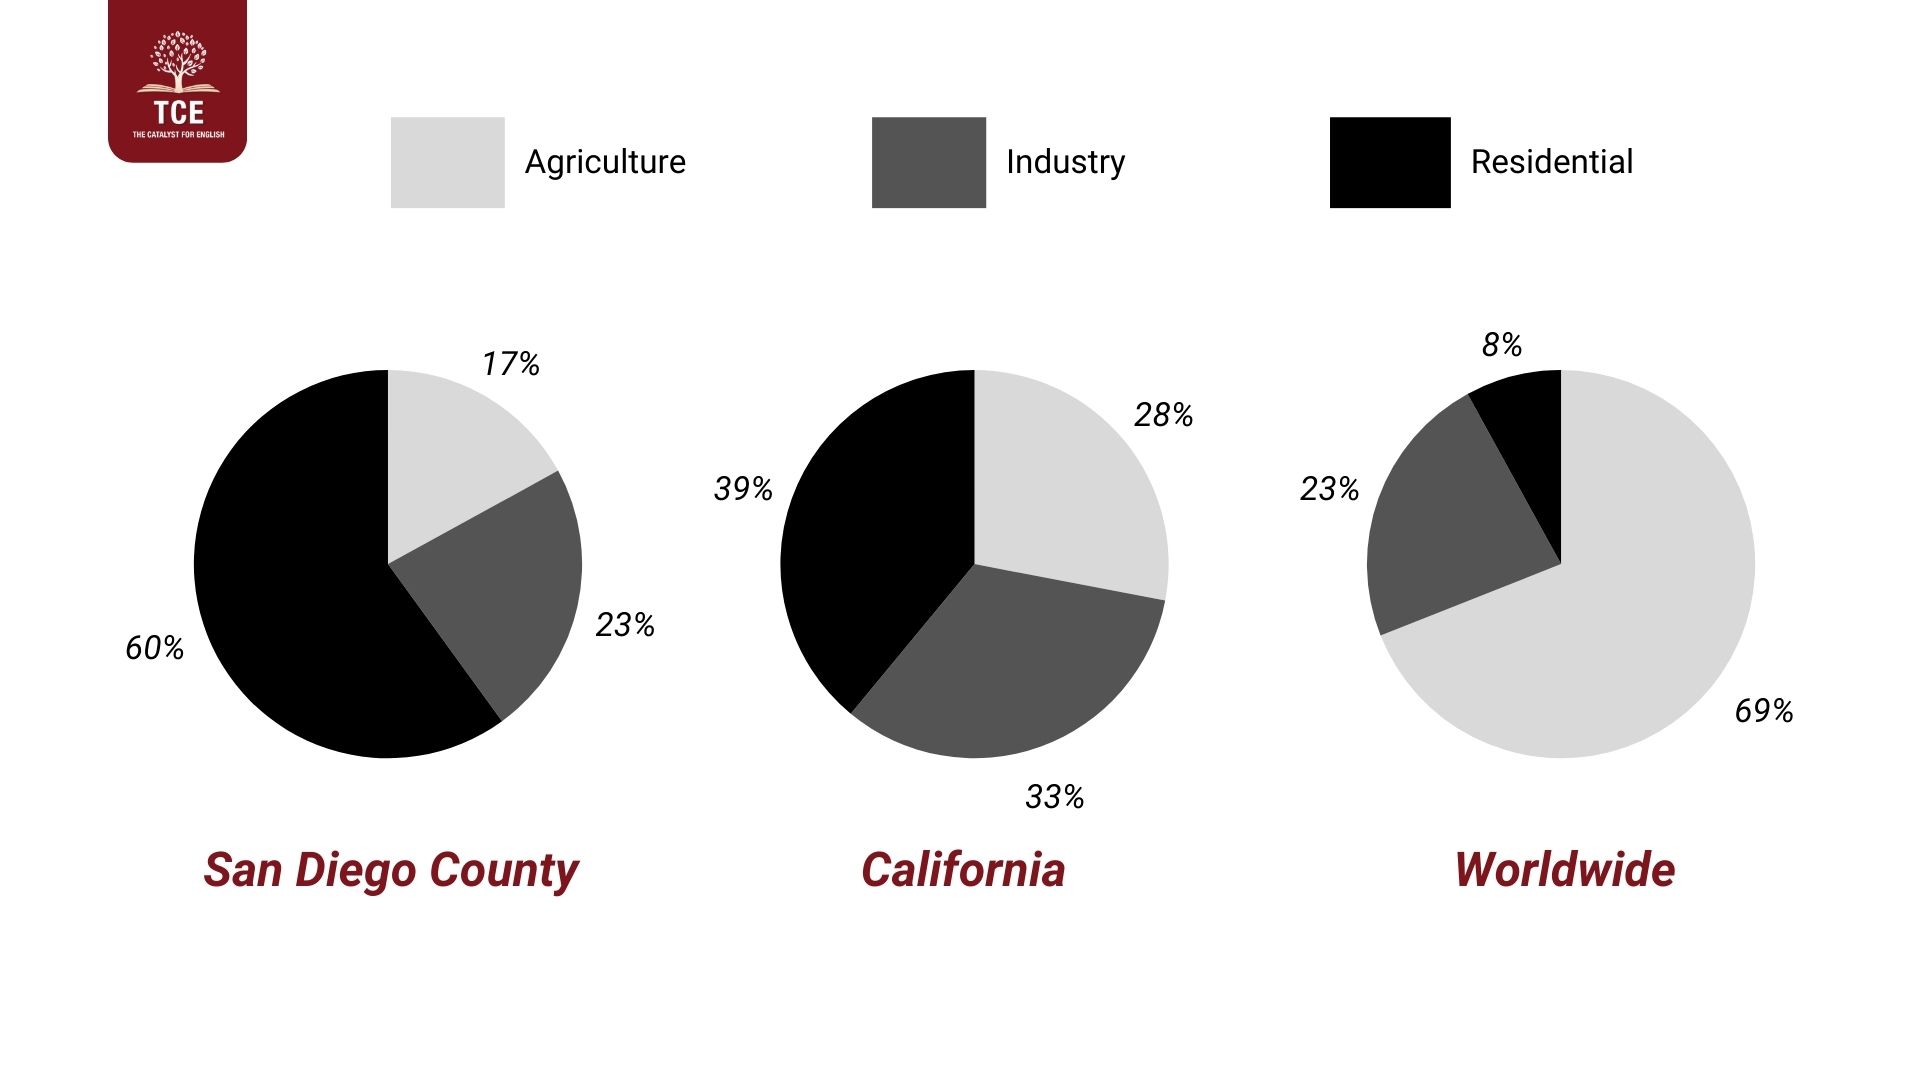
Ví dụ về Pie Chart
2. Các dạng bài Pie chart
IELTS Writing Task 1 Pie Chart có thể chia thành hai dạng chính sau:
- Biểu đồ tròn tĩnh (static chart): Là loại biểu đồ mô tả một đối tượng cụ thể (như quốc gia, thành phố hoặc giới tính) mà không có sự so sánh giữa các thời điểm khác nhau. Thông thường, chỉ có một biểu đồ tròn duy nhất được sử dụng.
- Biểu đồ tròn biến động (dynamic chart): Là loại biểu đồ thay đổi theo thời gian, với mỗi biểu đồ thể hiện thông tin cho một năm hoặc tháng cụ thể. Loại biểu đồ này thường bao gồm nhiều biểu đồ khác nhau để thể hiện sự biến đổi.
3. Cấu trúc của dạng bài Pie chart
Cấu trúc một bài viết dạng IELTS Writing Task 1 Pie Chart có thể gồm:
- Introduction: Paraphrase lại đề bài và giới thiệu về nội dung của biểu đồ Pie chart.
- Overview: Nêu lên những đặc điểm nổi bật của biểu đồ tròn, ví dụ như phần lớn nhất hoặc nhỏ nhất của biểu đồ tròn.
- Details: Mô tả cụ thể các số liệu trong pie charts và so sánh chúng.
II. Từ vựng và cấu trúc câu dùng trong IELTS Writing Task 1 Pie Chart
Trong IELTS Writing Task 1 Pie Chart, từ vựng và cấu trúc ngữ pháp đóng vai trò quan trọng trong việc mô tả và so sánh số liệu một cách rõ ràng và chính xác. Hãy cùng TCE ghi nhớ một số từ vựng và cấu trúc ngữ pháp thường dùng trong IELTS Writing Task 1 Pie Chart nhé!
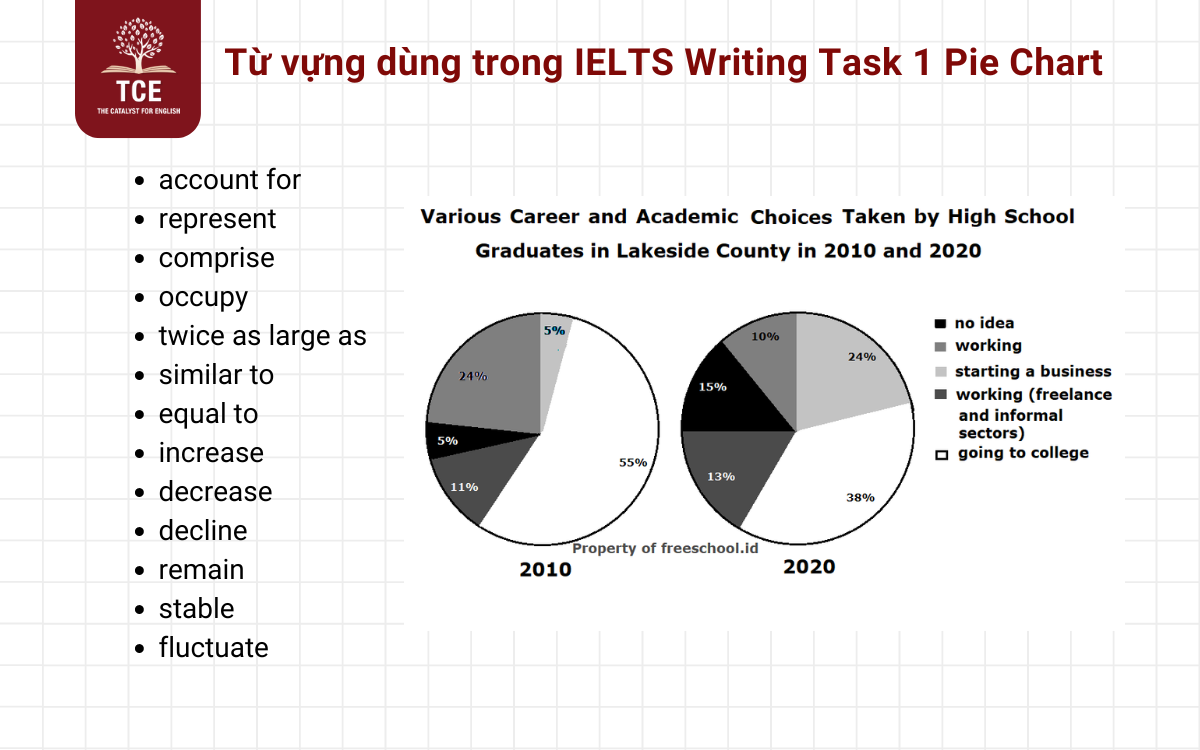
Từ vựng và cấu trúc câu dùng trong IELTS Writing Task 1 Pie Chart
1. Từ vựng dùng trong IELTS Writing Task 1 Pie Chart
| Từ Vựng |
Ý Nghĩa |
Ví Dụ |
| 1. Từ vựng mô tả tỷ lệ/phần trăm |
| account for |
Chiếm |
X accounts for 25% of the total.
(X chiếm 25% tổng số) |
| make up |
tạo thành |
Y makes up 30% of the chart.
(Y chiếm 30% của biểu đồ.) |
| represent |
đại diện |
This sector represents 15% of the total.
(Ngành này chiếm 15% tổng số.) |
| comprise |
bao gồm |
Z comprises a quarter of the pie.
(Z chiếm một phần tư của biểu đồ tròn) |
| occupy |
chiếm |
The smallest section occupies only 5%.
(Phần nhỏ nhất chỉ chiếm 5%.) |
| 2. Từ vựng mô tả so sánh |
| larger than |
lớn hơn |
Sector A is significantly larger than Sector B.
(Khu vực A lớn hơn nhiều so với khu vực B.) |
| smaller than |
nhỏ hơn |
Sector B is smaller than Sector C.
(Khu vực B nhỏ hơn khu vực C.) |
| the largest/the smallest |
lớn nhất/nhỏ nhất |
X accounts for the largest portion of the pie chart.
(X chiếm phần lớn nhất trong biểu đồ tròn.) |
| twice as large as |
gấp đôi |
Y is twice as large as Z.
(Y gấp đôi Z.) |
| similar to |
tương đương |
The percentages of X and Y are quite similar.
(Tỷ lệ phần trăm của X và Y khá giống nhau.) |
| equal to |
bằng |
X is equal to Y at 25%.
(X bằng Y ở mức 25%.) |
| 3. Từ vựng mô tả sự thay đổi theo thời gian |
| increase |
tăng |
The percentage of students who passed the exam increased/rose/grew by 10% from 2019 to 2020.
(Tỷ lệ học sinh vượt qua kỳ thi đã tăng 10% từ năm 2019 đến năm 2020.) |
| rise |
| grow |
| decrease |
giảm |
The number of unemployed people decreased/fell/declined by 5% over the last decade.
(Số lượng người thất nghiệp đã giảm 5% trong thập kỷ qua.) |
| fall |
| decline |
| remain stable |
ổn định |
The number of cars sold remained stable throughout the year.
(Số lượng xe được bán ra vẫn ổn định trong suốt cả năm.) |
| fluctuate |
biến động |
The temperature fluctuated between 20°C and 30°C during the week.
(Nhiệt độ đã dao động từ 20°C đến 30°C trong tuần vừa qua.) |
2. Cấu trúc ngữ pháp
| Cấu trúc |
Ý nghĩa |
Ví dụ |
| 1. Cấu trúc cho phần tổng quát (overview) |
| It is clear that |
Rõ ràng là |
It is clear that the majority of the chart is dominated by sector X.
(Rõ ràng là phần lớn biểu đồ bị chi phối bởi lĩnh vực X.) |
| The most noticeable feature is |
Đặc điểm nổi bật nhất là |
The most noticeable feature is the large percentage attributed to sector A.
(Đặc điểm dễ nhận thấy nhất là tỷ lệ lớn của biểu đồ tròn được gán cho lĩnh vực A.) |
| 2. Cấu trúc ngữ pháp cho phần thân bài (body) |
| Câu bị động |
Dùng để làm câu văn trang trọng hơn. |
The largest portion is taken up by X, which constitutes 40% of the total.
(Phần lớn nhất của biểu đồ tròn được chiếm bởi X, chiếm 40% tổng số.) |
| So sánh |
Để so sánh các phần khác nhau. |
X is larger than Y, accounting for 30% of the total, compared to Y’s 20%.
(X lớn hơn Y, chiếm 30% tổng số, so với Y là 20%.) |
| Mệnh đề quan hệ |
Để mô tả chi tiết hơn |
The section which represents 25% of the pie chart is dedicated to education.
(Phần mà chiếm 25% của biểu đồ hình tròn được dành cho giáo dục.) |
| Cấu trúc với “while” và “whereas” |
Để nối các câu mô tả sự tương phản |
X constitutes 50% of the chart, while/wheras Y accounts for only 10%.
(X chiếm 50% biểu đồ, trong khi Y chỉ chiếm 10%.) |
III. Hướng dẫn cách viết IELTS Writing Task 1 Pie Chart
Để đạt được điểm cao trong phần thi này, The Catalyst for English sẽ hướng dẫn bạn cách viết IELTS Writing Task 1 Pie Chart đối với 2 dạng biểu đồ tròn biến động và biểu đồ tròn tính. Tham khảo nhé:
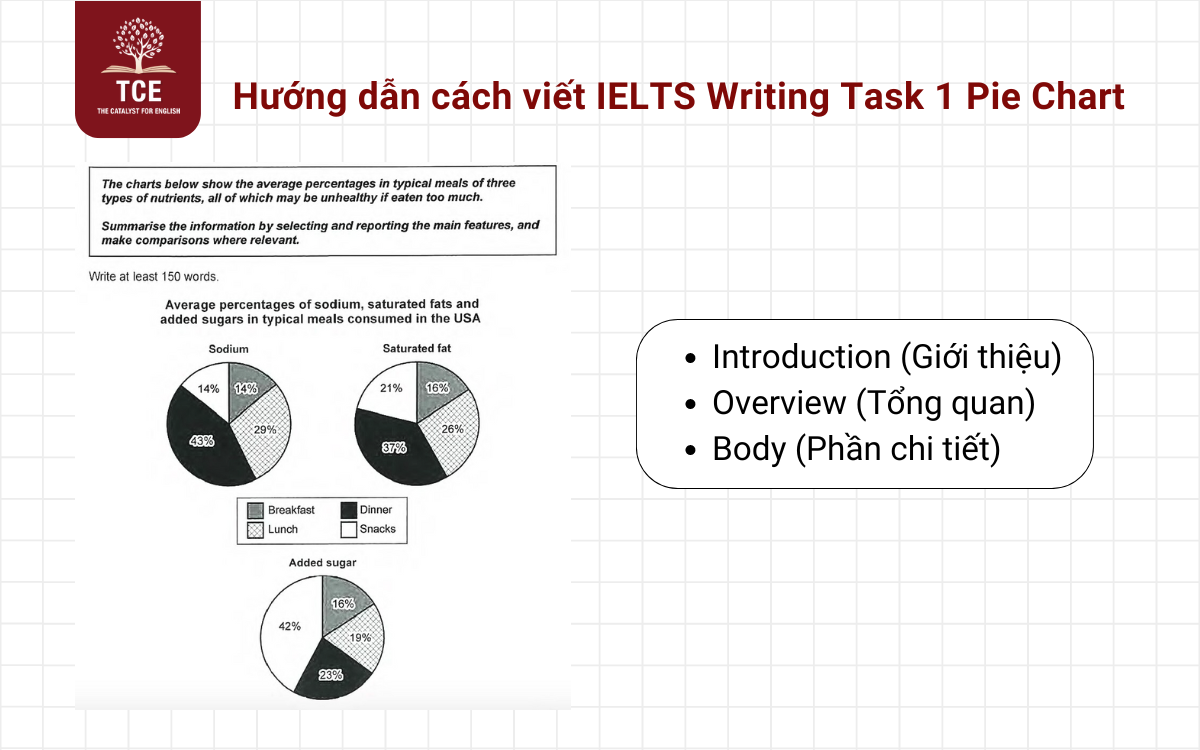
Hướng dẫn cách viết IELTS Writing Task 1 Pie Chart
1. Cách viết Writing Task 1 Pie Chart dạng biểu đồ tròn biến động
IELTS Writing Task 1 Pie Chart biến động (biểu đồ tròn so sánh sự thay đổi qua thời gian) yêu cầu người viết mô tả sự thay đổi của các danh mục theo từng mốc thời gian. Giờ hãy để TCE hướng dẫn bạn cách viết một bài viết hoàn chỉnh cho dạng biểu đồ tròn Pie chart biến động nhé!
a) Phân tích đề bài
Khi gặp dạng bài IELTS Writing Task 1 Pie Chart so sánh sự thay đổi theo thời gian, người viết cần:
- Xác định số lượng biểu đồ (ví dụ: 2 hoặc nhiều hơn cho các năm khác nhau).
- Nhận diện sự thay đổi về tỷ lệ phần trăm của từng danh mục.
- Tập trung vào việc so sánh và nêu rõ xu hướng tăng, giảm hoặc ổn định của các danh mục theo thời gian.
b) Cấu trúc bài viết
– Introduction (Giới thiệu)
- Paraphrase lại đề bài và tóm tắt nội dung chính của biểu đồ.
- Giới thiệu ngắn gọn về các mốc thời gian hoặc danh mục trong biểu đồ.
– Overview (Tổng quan)
- Nêu những đặc điểm nổi bật nhất của biểu đồ Pie Chart (ví dụ: danh mục lớn nhất, nhỏ nhất, xu hướng chung).
- Đề cập đến sự thay đổi rõ ràng nhất hoặc sự khác biệt lớn nhất giữa các mốc thời gian.
– Body (Phần chi tiết)
Thí sinh nên chia bài IELTS Writing Task 1 Pie Chart biến động thành hai đoạn chính:
Đoạn 1: Mô tả biểu đồ đầu tiên
- Nhấn mạnh các tỷ lệ của từng danh mục.
- So sánh giữa các danh mục lớn và nhỏ.
Đoạn 2: Mô tả sự thay đổi ở biểu đồ sau và so sánh
- Mô tả sự thay đổi của từng danh mục: tăng, giảm, hoặc giữ nguyên.
- Sử dụng các cấu trúc so sánh để làm nổi bật sự khác biệt giữa các mốc thời gian.
2. Cách viết Writing Task 1 Pie Chart dạng biểu đồ tròn tĩnh
Trái ngược với dạng IELTS Writing Task 1 Pie Chart động, IELTS Writing Task 1 Pie Chart tĩnh (biểu đồ tròn chỉ ra số liệu của một thời điểm cố định), thí sinh cần mô tả tỷ lệ của các danh mục mà không có sự thay đổi theo thời gian. TCE sẽ hướng dẫn các thí sinh chi tiết cách viết một bài hoàn chỉnh cho dạng bài này ngay sau đây, hãy cùng xem tiếp nhé!
a) Phân tích đề bài Writing Task 1 Pie Chart dạng biểu đồ tròn tĩnh
Khi gặp dạng bài IELTS Writing Task 1 Pie Chart tĩnh, các thí sinh cần:
- Nhận diện các danh mục và tỷ lệ phần trăm tương ứng.
- So sánh các tỷ lệ để tìm ra danh mục chiếm tỷ lệ lớn nhất và nhỏ nhất.
- Chú ý đến những mối liên hệ giữa các danh mục và nêu ra những điểm đáng chú ý.
b) Cấu trúc bài viết
– Introduction (Giới thiệu): Ở phần này, các bạn học viên cần:
- Paraphrase lại đề bài và giới thiệu ngắn gọn về nội dung biểu đồ.
- Không cần đi vào chi tiết ngay trong phần này, chỉ cần mô tả ngắn gọn về những gì biểu đồ thể hiện.
– Overview (Tổng quan): Người viết cần phải đạt được các yêu cầu sau:
- Nhấn mạnh các đặc điểm nổi bật nhất của biểu đồ, chẳng hạn như danh mục chiếm tỷ lệ lớn nhất, nhỏ nhất, hoặc bất kỳ sự chênh lệch đáng kể nào.
- Nêu tổng quan về các điểm đáng chú ý mà không cần đi vào chi tiết số liệu cụ thể.
– Body (Phần chi tiết)
Bạn nên chia phần thân bài của IELTS Writing Task 1 Pie Chart tĩnh thành hai đoạn:
Đoạn 1: Mô tả các danh mục lớn nhất
- Bắt đầu bằng việc mô tả danh mục lớn nhất và các danh mục có tỷ lệ tương tự.
- So sánh các danh mục có tỷ lệ lớn để làm nổi bật sự khác biệt.
Đoạn 2: Mô tả các danh mục nhỏ hơn và so sánh
- Mô tả các danh mục có tỷ lệ nhỏ hơn và đưa ra sự so sánh.
- Sử dụng các từ vựng so sánh để thể hiện sự chênh lệch.
IV. 02 bài mẫu IELTS Writing Task 1 Pie Chart kèm từ vựng
“Trăm nghe không bằng mắt thấy”, ngay bây giờ TCE sẽ gửi bạn 02 bài mẫu đối với dạng bài IELTS Writing Task 1 Pie Chart để các bạn tham khảo nhé:
1. IELTS Writing Task 1 Pie Chart sample 01
A. Đề bài:
The pie charts below show the percentage of housing owned and rented in the UK in 1991 and 2007. Summarize the information by selecting and reporting the main features, and make comparisons where relevant.
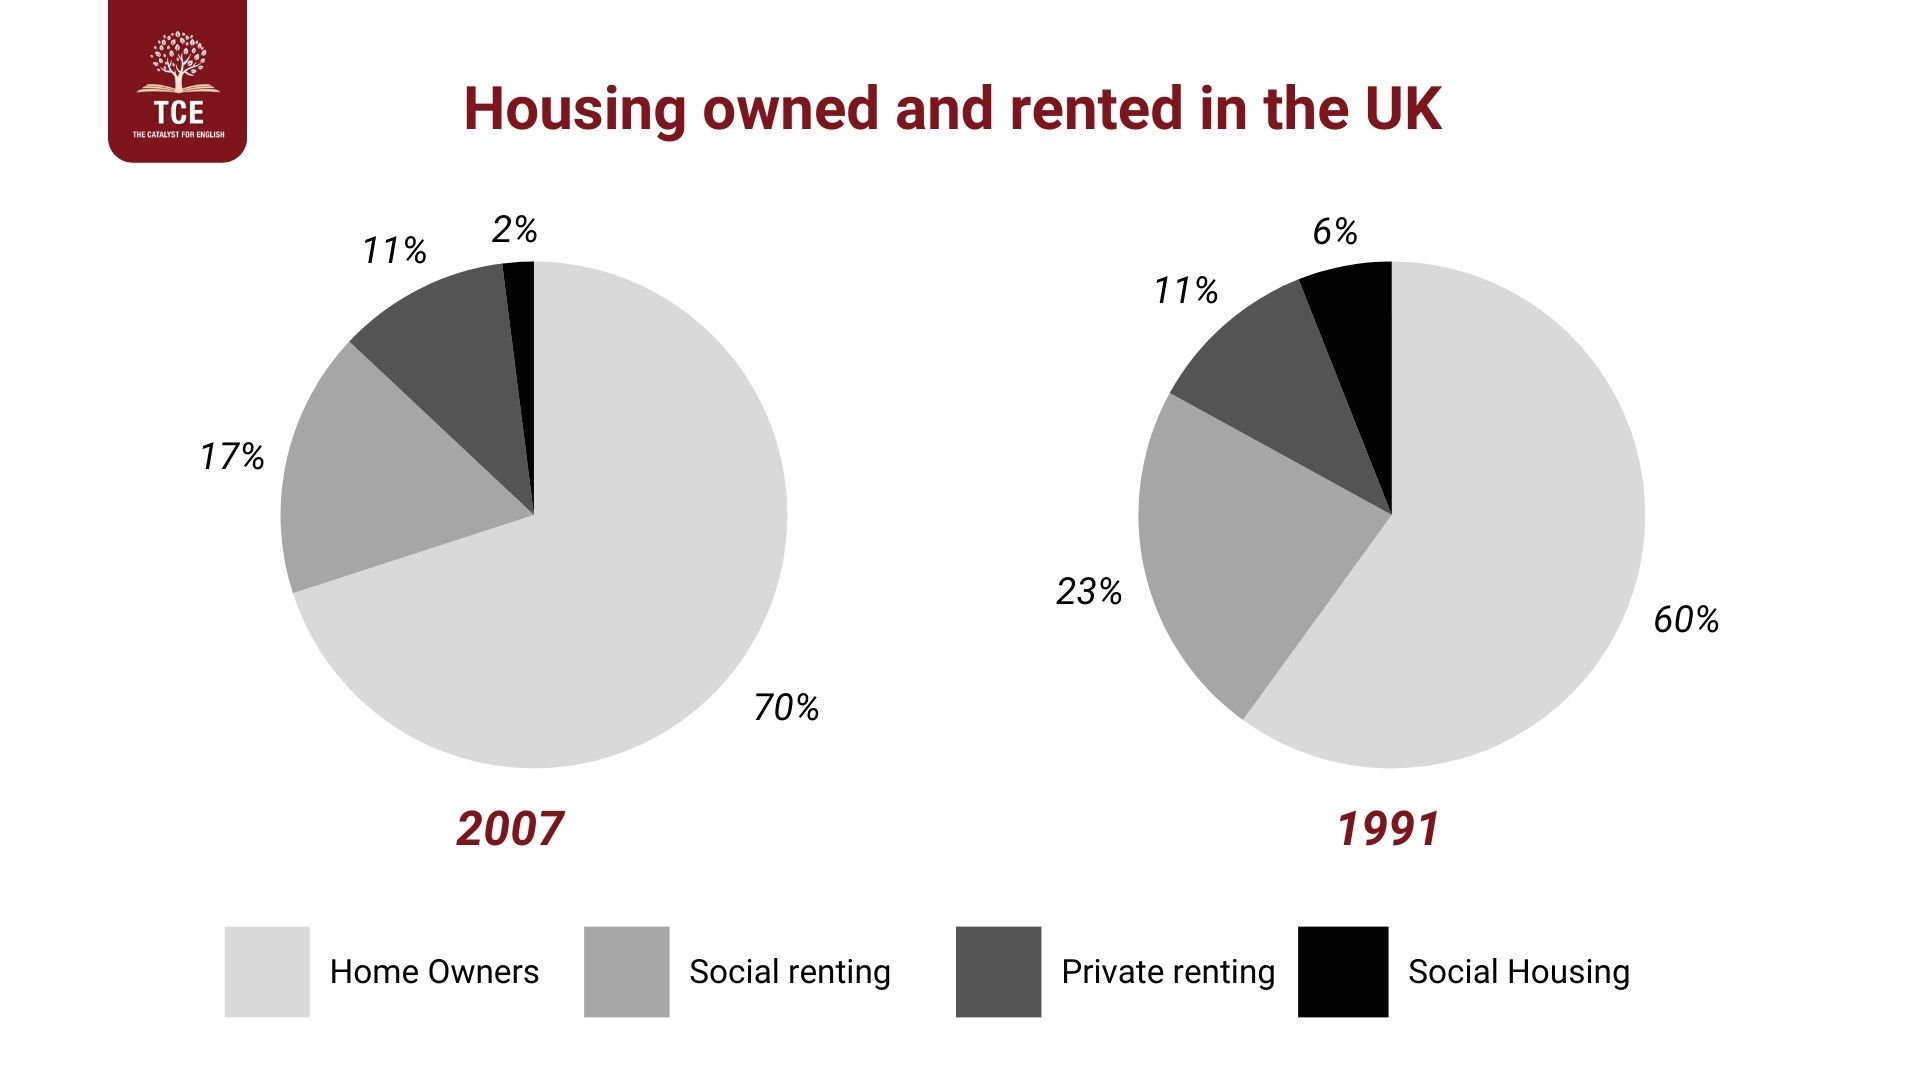
IELTS Writing Task 1 Pie Chart sample 01
B. Phân tích đề bài
- Loại biểu đồ:
- Đây là dạng biểu đồ tròn kép (multiple pie charts) vì có hai biểu đồ tròn so sánh tỷ lệ của các loại nhà ở giữa hai mốc thời gian khác nhau là 1991 và 2007.
- Biểu đồ này thuộc dạng dynamic pie chart (biểu đồ tròn thay đổi theo thời gian) vì nó mô tả sự thay đổi về tỷ lệ các loại nhà được sở hữu hoặc cho thuê trong khoảng thời gian từ 1991 đến 2007.
- Thông tin yêu cầu:
- Đối tượng được mô tả: Các loại nhà ở (owned or rented homes), cụ thể là số lượng nhà thuộc sở hữu cá nhân hoặc nhà thuê ở Anh (UK).
- Thời gian: Hai mốc thời gian cụ thể là năm 1991 và năm 2007. Việc thay đổi theo thời gian sẽ là yếu tố quan trọng cần nhấn mạnh.
- Nội dung cần phân tích: So sánh tỷ lệ của nhà được sở hữu và nhà được thuê trong hai thời điểm để xem có những thay đổi gì trong suốt thời gian này.
- Chiến lược viết:
- Introduction: Nêu lại đề bài bằng cách paraphrase để giới thiệu về biểu đồ,
- Overview: Đưa ra cái nhìn tổng quát, nhấn mạnh sự khác biệt hoặc tương đồng lớn nhất giữa các năm của biểu đồ pie charts.
-
- Miêu tả sự khác biệt cụ thể giữa từng loại nhà (owned and rented) theo hai thời điểm, sử dụng ngôn ngữ mô tả sự thay đổi về số liệu như increased, decreased, remained steady, fluctuated, v.v.
- Ví dụ: “In 1991, the majority of homes were rented, accounting for X% of the total. However, by 2007, this figure had decreased to Y%.”
- Lưu ý:
- Phải so sánh sự thay đổi giữa hai năm và không chỉ mô tả từng năm riêng lẻ.
- Nhấn mạnh các con số lớn nhất, nhỏ nhất và các xu hướng tăng hoặc giảm rõ rệt của biểu đồ Pie charts.
C. Bài viết mẫu
The pie charts illustrate the proportion of homes that were owned or rented in the UK in the years 1991 and 2007.
Overall, it is clear that the majority of homes were owner-occupied in both years, and this trend became even more pronounced by 2007. The percentage of social renting and housing provided by local authorities saw a notable decrease during the period, while private renting remained relatively stable.
In 1991, home ownership accounted for just over half of all housing at 60%, but this figure rose significantly to 70% by 2007. Conversely, the proportion of social rented homes experienced a decline from 23% to 17%. Similarly, homes rented from local authorities dropped sharply, from 11% in 1991 to just 6% in 2007.
Meanwhile, the percentage of privately rented homes remained almost unchanged, making up 11% in 1991 and 10% in 2007. In terms of overall housing availability, the total number of homes increased by approximately 5 million over the period.
Phân tích từ vựng và cấu trúc tốt:
| notable (a) |
đáng kể, rõ rệt |
| relatively (adv) |
khá= quite |
| conversely (adv) |
Trái ngược |
| account for |
chiếm |
| similarly (adv) |
tương tự |
| make up |
chiếm |
| in terms of |
xét về khía cạnh |
| availability (n) |
sự sẵn có |
| Cấu trúc |
Câu trong bài |
Ý nghĩa |
| Mệnh đề quan hệ |
The percentage of privately rented homes, which remained almost unchanged… |
Thí sinh nên sử dụng được mệnh đề quan hệ trong bài để miêu tả kĩ hơn thông tin được đưa ra. |
| Câu bị động |
Homes that were owned or rented in the UK in 1991 and 2007. |
Câu bị động sẽ giúp thí sinh đa dạng cấu trúc câu thay vì chỉ sử dụng câu chủ động. |
| Cấu trúc “while” |
The percentage of social renting and housing provided by local authorities saw a notable decrease during the period, while private renting remained relatively stable. |
Đây là cấu trúc tốt giúp bạn ăn điểm để thể hiện sự đối lập giữa hai thông tin với nhau. |
2. Bài mẫu IELTS Writing Task 1 Pie Chart 02
A. Đề bài:
The pie charts compare the percentage of household expenditures in five categories in Japan and Malaysia. Summarize the information by selecting and reporting the main features, and make comparisons where relevant.
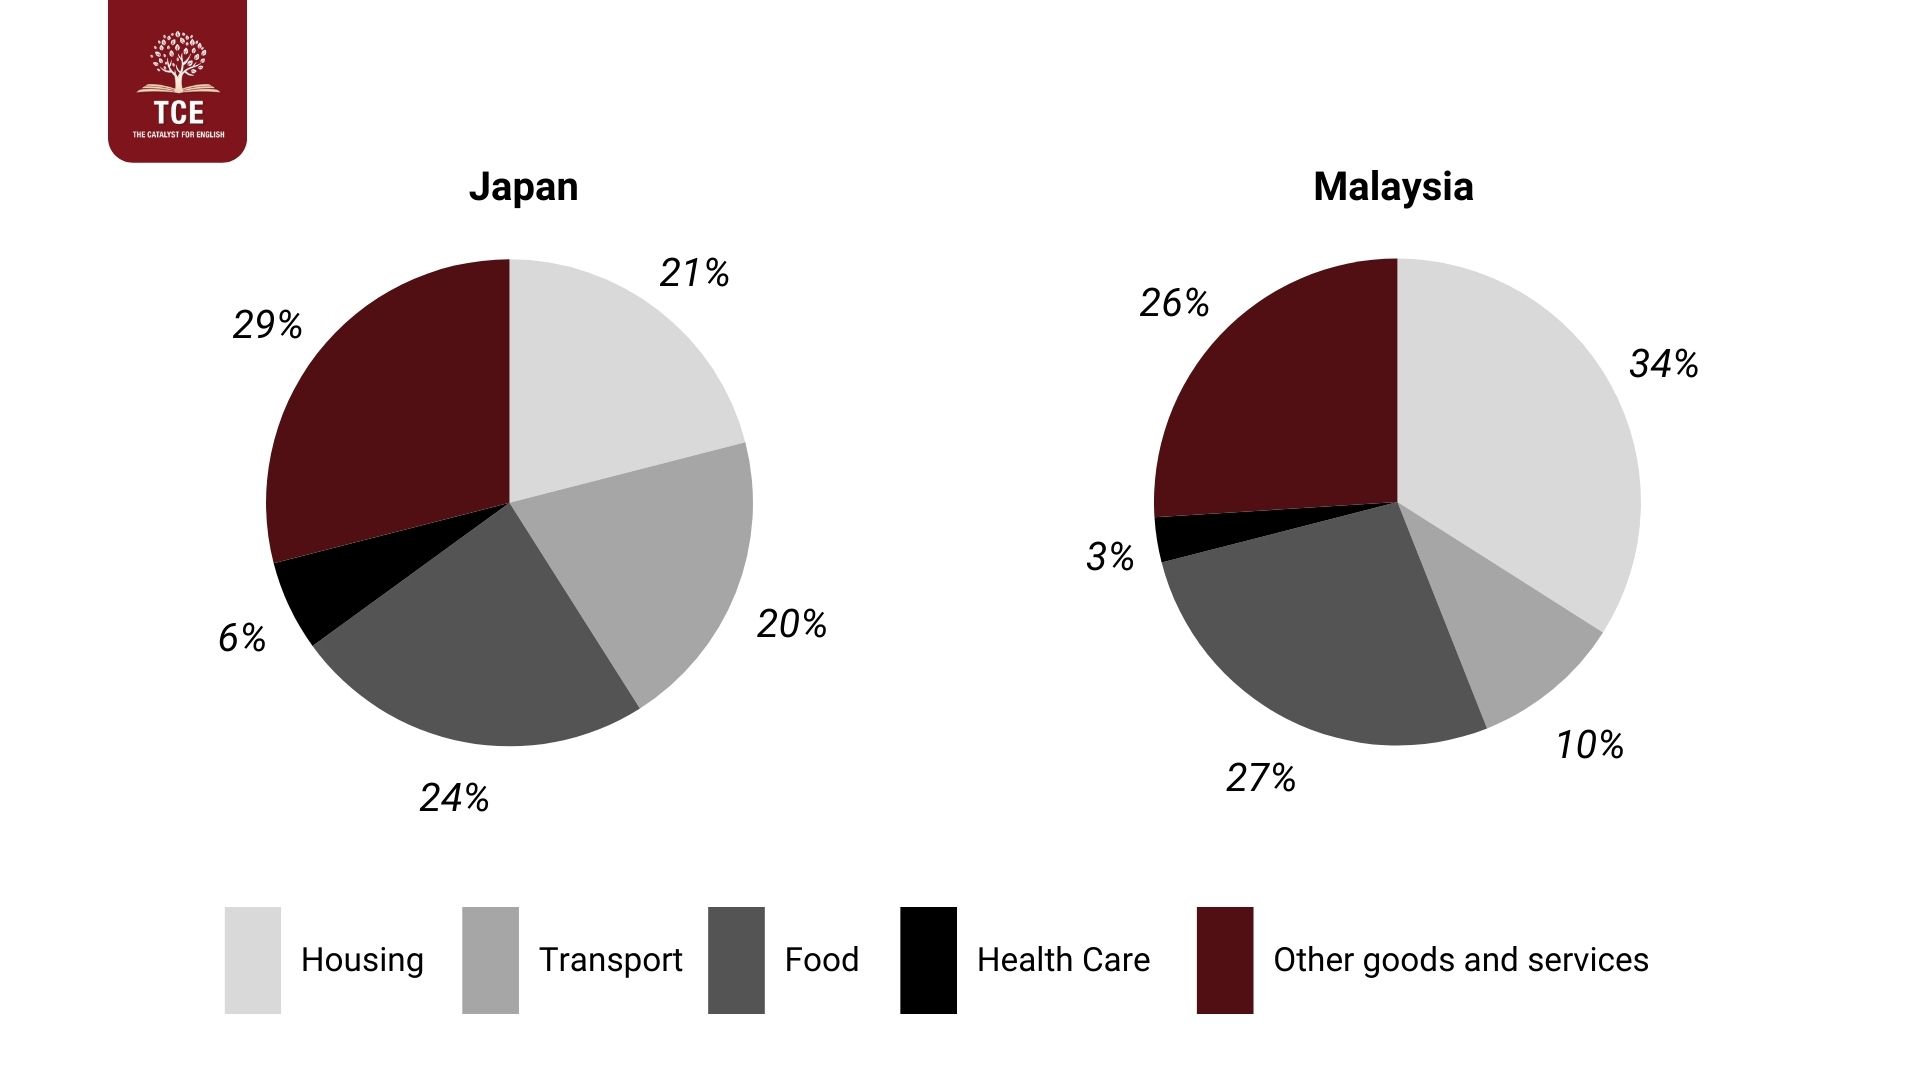
Bài mẫu IELTS Writing Task 1 Pie Chart 02
B. Phân tích đề bài:
- Loại biểu đồ:
- Đây là dạng biểu đồ tròn kép (multiple pie charts) thể hiện sự so sánh tỷ lệ chi tiêu của hộ gia đình tại hai quốc gia Nhật Bản và Malaysia.
- Biểu đồ tĩnh vì nó không thay đổi theo thời gian mà chỉ so sánh hai quốc gia tại cùng một thời điểm.
- Đối tượng mô tả:
- Tỷ lệ chi tiêu cho năm loại mục chi tiêu chính: Housing (Nhà ở), Transport (Giao thông vận tải), Food (Thực phẩm), Health care (Chăm sóc sức khỏe) và Other goods and services (Các hàng hóa và dịch vụ khác) tại Nhật Bản và Malaysia.
- Nội dung cần phân tích:
- So sánh tỷ lệ chi tiêu giữa hai quốc gia ở từng mục. Từ đó nêu ra các sự khác biệt đáng chú ý về các mục chi tiêu chiếm tỷ trọng lớn hay nhỏ hơn giữa hai quốc gia.
- Cấu trúc bài viết:
- Introduction: Giới thiệu biểu đồ và đối tượng được so sánh (tỷ lệ chi tiêu tại Nhật Bản và Malaysia).
- À Overview: Tóm tắt điểm khác biệt chính giữa hai quốc gia, ví dụ như danh mục nào có tỷ lệ chi tiêu cao nhất, thấp nhất.
- Detail paragraphs: Phân tích chi tiết từng danh mục, so sánh cụ thể sự khác nhau về tỷ lệ chi tiêu giữa Nhật Bản và Malaysia.
C. Bài viết mẫu:
The pie charts illustrate the proportion of household expenditures in five categories in Japan and Malaysia. These categories include housing, transport, food, health care, and other goods and services.
Overall, it is evident that housing and other goods and services make up the largest portions of household spending in both countries, but the specific percentages vary. Japan spends a higher proportion on transport and health care, while Malaysia allocates more of its budget to housing and food.
In Japan, housing accounts for 21% of total household expenditure, which is lower than Malaysia, where it makes up 34%. However, Japanese households spend more on transport (20%) compared to Malaysian households, which only allocate 10% to this category. Similarly, Japanese expenditure on health care is 6%, double the 3% spent by Malaysia.
Regarding food, Japan and Malaysia show different patterns. In Japan, 24% of household expenditure goes to food, whereas this figure is higher in Malaysia at 27%. Lastly, both countries spend a significant portion of their budget on other goods and services, with Japan at 29% and Malaysia at 26%.
In conclusion, while both countries allocate the largest portions of their household budgets to other goods and services, the specific proportions spent on categories such as housing, food, transport, and health care differ considerably between Japan and Malaysia.
| illustrate (v) |
Diễn tả, minh họa. (Đây là một từ thường dùng để bắt đầu phần mô tả biểu đồ.) |
| expenditure (n) |
Sự chi tiêu. (Một từ vựng học thuật cao khi đề cập đến chi phí của hộ gia đình.) |
| allocate (v) |
Phân bổ. (Dùng để nói về việc dành ra một phần ngân sách cho một mục cụ thể.) |
| category (n) |
Hạng mục. (Từ này được dùng để nói về các mục chi tiêu trong biểu đồ.) |
| account for |
Chiếm bao nhiêu phần trăm. |
| expenditure patterns |
Các mô hình chi tiêu. (Từ vựng nâng cao để nói về thói quen tiêu dùng của các hộ gia đình.) |
V. Một số lỗi thường gặp khi viết dạng bài pie chart
Dưới đây là một số lỗi phổ biến mà thí sinh thường mắc phải khi làm bài IELTS Writing Task 1 Pie Chart mà đội ngũ chuyên môn của TCE đã tổng hợp:
1. Không có Overview rõ ràng
- Lỗi: Nhiều thí sinh bỏ qua phần Overview trong IELTS Writing Task 1 Pie Chart hoặc viết không rõ ràng.
- Cách khắc phục: Overview là phần rất quan trọng, giúp người chấm hiểu được những đặc điểm nổi bật của biểu đồ. Đảm bảo rằng bạn tóm tắt ngắn gọn về xu hướng chính, danh mục lớn nhất, nhỏ nhất mà không đi sâu vào chi tiết số liệu.
Ví dụ lỗi: “The pie chart shows different categories.” Ví dụ sửa: “It is clear that the industrial sector accounted for the largest portion, while transportation consumed the least.”
2. Mô tả quá chi tiết từng con số
- Lỗi: Khi làm bài IELTS Writing Task 1 Pie Chart, người viết thường ghi lại tất cả các số liệu mà không có sự tóm tắt, làm cho bài viết rườm rà và mất trọng tâm.
- Cách khắc phục: Chỉ chọn những con số quan trọng và tập trung vào việc so sánh, nhận xét chung thay vì liệt kê từng tỷ lệ phần trăm.
Ví dụ lỗi: “The industrial sector is 45%, the residential sector is 30%, transportation is 15%, and commercial is 10%.” Ví dụ sửa: “The industrial sector dominates with 45%, followed by the residential sector at 30%.”
3. Không có sự so sánh giữa các danh mục
- Lỗi: Một số bạn đi thi chỉ mô tả từng danh mục mà không có sự so sánh giữa chúng, dẫn đến bài viết thiếu chiều sâu.
- Cách khắc phục: So sánh tỷ lệ của các danh mục với nhau, nêu rõ danh mục nào lớn hơn, nhỏ hơn, hoặc tương đương nhau.
Ví dụ lỗi: “The industrial sector is 45%, and the residential sector is 30%.” Ví dụ sửa: “The industrial sector accounts for 45%, which is significantly larger than the residential sector at 30%.”
4. Sử dụng từ vựng và ngữ pháp đơn giản, lặp lại
-
Lỗi: Thí sinh thường lặp lại những từ cơ bản như “big”, “small”, “increase”, “decrease” quá nhiều lần mà không thay đổi từ ngữ hoặc cấu trúc câu.
-
Cách khắc phục: Lỗi này thường xuất phát từ việc thiếu một nền tảng ngữ pháp và từ vựng vững chắc ngay từ đầu. Để xây dựng nền tảng này một cách bài bản, bạn nên tham khảo lộ trình học IELTS từ 0 đến 6.5. Một lộ trình rõ ràng sẽ giúp bạn trang bị đủ vốn từ và cấu trúc đa dạng, từ đó tránh được việc lặp từ một cách đáng tiếc.
Ví dụ lỗi: “The transportation is very small, and the industrial sector is big.” Ví dụ sửa: “Transportation constitutes the smallest share, while the industrial sector represents the largest portion.”
5. Không mô tả hết các danh mục
- Lỗi: Một số học viên bỏ sót không mô tả tất cả các danh mục trong biểu đồ.
- Cách khắc phục: Đảm bảo rằng tất cả các danh mục đều được nhắc đến, dù chỉ là một số phần trăm nhỏ. Thí sinh có thể nhóm các danh mục có tỷ lệ tương tự nhau.
Ví dụ lỗi: “The pie chart shows the industrial and residential sectors.” Ví dụ sửa: “The industrial sector accounts for 45%, followed by the residential sector at 30%, while commercial and transportation each make up smaller portions at 15% and 10% respectively.”
6. Không sử dụng cấu trúc so sánh hoặc không nhấn mạnh sự khác biệt
- Lỗi: Thí sinh không nhấn mạnh được sự khác biệt giữa các danh mục, khiến bài viết trở nên rập khuôn.
- Cách khắc phục: Sử dụng các từ và cấu trúc so sánh để làm nổi bật sự khác biệt giữa các danh mục.
Ví dụ lỗi: “The industrial sector is 45%, and the transportation sector is 10%.” Ví dụ sửa: “The industrial sector dominates with 45%, which is over four times larger than the transportation sector at just 10%.”
7. Nhầm lẫn về số liệu
- Lỗi: Học viên có thể nhầm lẫn giữa các số liệu hoặc mô tả sai thông tin trong biểu đồ.
- Cách khắc phục: Đọc kỹ biểu đồ và chắc chắn rằng bạn hiểu đúng số liệu trước khi viết. Đừng vội vàng khi ghi lại các số liệu.
Ví dụ lỗi: “The transportation sector accounts for 45%, making it the largest sector.” Ví dụ sửa: “The industrial sector accounts for 45%, making it the largest sector.”
8. Không quản lý thời gian
- Lỗi: Một số thí sinh dành quá nhiều thời gian vào một phần của bài viết, dẫn đến bài viết thiếu hụt thông tin hoặc không đủ thời gian để hoàn thiện.
- Cách khắc phục: Phân bổ thời gian hợp lý, dành khoảng 5 phút để lập dàn ý, 15 phút để viết, và 5 phút để xem lại và chỉnh sửa.
Hy vọng rằng với những chia sẻ trên, bạn đã hoàn toàn tự tin chinh phục dạng bài Pie Chart. Đây là một bước tiến quan trọng trên hành trình đạt điểm cao môn Writing! Để tiếp tục đồng hành cùng bạn, TCE đã chuẩn bị sẵn một kho tàng kiến thức về IELTS Writing với đầy đủ các dạng bài và chiến lược cho cả Task 1 và Task 2. Đừng quên khám phá nhé!




![[PDF + Audio] Tải sách New Insight Into IELTS miễn phí](https://thecatalyst.edu.vn/blogs/wp-content/uploads/2026/02/new-insight-into-ielts.jpg)
